Blog
Changes to the mortgage stress test
Ottawa, ON, February 18, 2020 – Earlier today, Minister of Finance Bill Morneau announced changes to the mortgage stress test. The new benchmark rate used to determine the minimum qualifying rate for insured mortgages, coming into effect on April 6, 2020, will be the weekly median 5-year fixed insured mortgage rate from mortgage insurance applications, plus 2 per cent. Recently, the gap between the Bank of Canada’s five-year benchmark rate and borrowers’ actual contract rates has been widening, suggesting the benchmark rate has become less responsive to changes in the market. In October 2016, Finance Canada introduced a stress test for insured mortgages. In 2017, the Office of the Superintendent of Financial Institutions (OSFI) issued an update to Guideline B-20, requiring uninsured mortgages to be stress-tested as of January 2018. CREA data indicates that per capita sales activity for residential units in 2018 reached its lowest point since 2001, with 2019’s final sales total tied for second-worst. “REALTORS® have advocated for changes to the stress test on behalf of potential homeowners who have been sidelined, borrowers who have moved away from the regulated market to less-regulated options, and real estate markets across the country in need of relief,” said Jason Stephen, President of The Canadian Real Estate Association. “We are pleased the government has taken steps to address some of these issues in Canadian housing markets.” In response to the impacts of the stress test, CREA has recommended: reviewing the mortgage stress test to ensure the realities of local real estate markets are taken into consideration; and allowing existing mortgage holders to be exempted from the stress test at the time of renewal. CREA welcomes today’s announcement and acknowledges government’s efforts to help Canadians achieve their housing needs through policy reflective of market conditions. CREA CEO Michael Bourque said “Today’s announcement introduces a more dynamic measure to act as a minimum qualifying rate. The Bank of Canada’s weekly median 5-year fixed insured mortgage rate plus 200 basis points will be more responsive.” CREA will be providing input as OSFI considers the same benchmark rate for uninsured mortgages and will continue advocating for policy solutions that make it easier for Canadians to find a home that is right for them. For more information, please contact: Pierre Leduc, Media Relations pleduc@crea.ca The Canadian Real Estate Association 200 Catherine Street, 6th Floor Ottawa, ON K2P 2K9 Tel: +1 (613)...
read moreCanadian home sales down in January
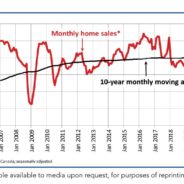
Ottawa, ON, February 14, 2020 – Statistics released today by the Canadian Real Estate Association (CREA) show national home sales declined between December 2019 and January 2020. Highlights: National home sales fell by 2.9% on a month-over-month (m-o-m) basis in January. Actual (not seasonally adjusted) activity was up 11.5% year-over-year (y-o-y). The number of newly listed properties was little changed (+0.2%) m-o-m. The MLS® Home Price Index (HPI) advanced by 0.8% m-o-m and 4.7% y-o-y. The actual (not seasonally adjusted) national average sale price climbed 11.2% y-o-y. Home sales recorded over Canadian MLS® Systems declined by 2.9% in January 2020, although they remain among the stronger monthly readings of the last few years. (Chart A) Transactions were down in a little over half of all local markets in January, with the national result most impacted by a slowdown of more than 18% in the Lower Mainland of British Columbia. While there were few notable gains in January, it should be noted that many of the weaker results have come alongside a shortage of new supply in markets where inventories are already very tight. Actual (not seasonally adjusted) sales activity was still up 11.5% compared to January 2019, marking the best sales figures for the month in 12 years. Transactions surpassed year-ago levels in about two-thirds of all local markets, including most of the largest urban markets. As mentioned, some of the larger markets where sales were down, such as Ottawa and Windsor-Essex, are currently among some of the tightest supplied markets in Canada. “Home price growth continues to pick up in housing markets where listings are in short supply, particularly in Southern, Central and Eastern Ontario,” said Jason Stephen, president of CREA. “Meanwhile, ample supply across the Prairies and in Newfoundland and Labrador is resulting in ongoing competition among sellers. All real estate is local, and nobody knows that better than a professional REALTOR®, your best source for information and guidance when negotiating the sale or purchase of a home,” said Stephen. “Looking at local market trends across the country, one thing that stands out in markets with historically tight supply is a larger than normal drop in new listings at this time of the year,” said Shaun Cathcart, CREA’s Senior Economist. “The logic being that if you are a seller, you’re not just choosing when to list but effectively when to sell, so why not hold off until the spring when the weather is better, and more buyers are looking? Deferred listings mean deferred sales, which could explain some of January’s decline in activity. The question going forward is how many sellers are out there waiting to list their property, how much demand will respond, and how that will impact prices later this year.” The number of newly listed homes was little changed in January, edging up a slight 0.2% on the heels of a series of declines which have left new listings at a near decade low. January’s small m-o-m change came as the result of declines in a number of larger markets, including Calgary, Edmonton and Montreal, which were offset by gains in the York and Durham Regions of the Greater Toronto Area (GTA) where new supply bounced back at the start of 2020 following a sharp slowdown towards the end of last year. With sales...
read moreCREA’s Chief Economist, Gregory Klump, retires after 28 years

Ottawa, ON, February 11, 2020 – Gregory Klump, CREA’s Chief Economist, has retired from The Canadian Real Estate Association after 28 years. Klump joined CREA in 1992, serving as staff economist for the Association. Promoted to Chief Economist in 2005, he grew CREA’s economic and data team into an authoritative source of Canadian real estate data and market analysis. Klump was instrumental in the development of the MLS® Home Price Index (MLS HPI®). He was a member of CMHC’s National Housing Research Committee as well as a contributor to the Economic Research Committee of the Canadian Home Builders Association. CREA wishes Gregory Klump all the best in his future endeavors. – 30 – About The Canadian Real Estate Association The Canadian Real Estate Association (CREA) is one of Canada’s largest single-industry associations. CREA works on behalf of more than 130,000 REALTORS® who contribute to the economic and social well-being of communities across Canada. Together they advocate for property owners, buyers and sellers. For more information, please contact: Pierre Leduc, Media Relations The Canadian Real Estate Association Tel.: 613-237-7111 or 613-884-1460 E-mail:...
read moreCanadian home sales inch lower in December

Ottawa, ON, January 15, 2020 – Statistics released today by the Canadian Real Estate Association (CREA) show national home sales eased between November and December 2019. Highlights: National home sales declined by 0.9% on a month-over-month (m-o-m) basis in December. Actual (not seasonally adjusted) activity was up 22.7% year-over-year (y-o-y). The number of newly listed properties dropped by a further 1.8% m-o-m. The MLS® Home Price Index (HPI) advanced by 0.8% m-o-m and 3.4% y-o-y. The actual (not seasonally adjusted) national average sale price climbed 9.6% y-o-y. Home sales recorded over Canadian MLS® Systems edged down 0.9% in December 2019, ending a streak of monthly gains that began last March. Activity is currently about 18% above the six-year low reached in February 2019 but ends the year about 7% below the heights recorded in 2016 and 2017. There was an almost even split between the number of local markets where activity rose and those where it declined, with higher sales in the Lower Mainland of British Columbia, Calgary and Montreal offsetting declines in the Greater Toronto Area (GTA) and Ottawa. Actual (not seasonally adjusted) activity was up 22.7% compared to a quiet month of December in 2018. Transactions surpassed year-ago levels across most of Canada, including all of the largest urban markets. “Home price growth is picking up in housing markets where listings are in short supply,” said Jason Stephen, president of CREA. “Meanwhile, the mortgage stress-test continues to sideline potential home buyers where supply is ample. All real estate is local, and nobody knows that better than a professional REALTOR®, your best source for information and guidance when negotiating the sale or purchase of a home,” said Stephen. “The momentum for home price gains picked up as last year came to a close,” said Gregory Klump, CREA’s Chief Economist. “If the recent past is prelude, then price trends in British Columbia, the GTA, Ottawa and Montreal look set to lift the national result this year, despite the continuation of a weak pricing environment among housing markets across the Prairie region.” The number of newly listed homes slid a further 1.8% in December, leaving new supply close to its lowest level in a decade. December’s decline was driven mainly by fewer new listings in the GTA and Ottawa–the same markets most responsible for the decline in sales. Listings available for purchase are now running at a 12-year low. The number of housing markets with a shortage of listings is on the rise; should current trends persist, fewer available listings will likely increasingly weigh on sales activity. With new listings having declined by more than sales, the national sales-to-new listings ratio further tightened to 66.9% in December 2019 – the highest reading since the spring of 2004. The long-term average for this measure of housing market balance is 53.7%. Barring an unforeseen change in recent trends for the balance between the supply and demand for homes, price gains appear poised to accelerate in 2020. Considering the degree and duration to which market balance readings are above or below their long-term averages is the best way of gauging whether local housing market conditions favour buyers or sellers. Market balance measures that are within one standard deviation of their long-term average are generally consistent with balanced market conditions. Based on a comparison...
read moreCanadian home sales edge higher in November

Ottawa, ON, December 16, 2019 – Statistics released today by the Canadian Real Estate Association (CREA) show national home sales continued to edge higher in November 2019. Highlights: National home sales rose 0.6% month-over-month (m-o-m) basis in November. Actual (not seasonally adjusted) activity was up 11.3% year-over-year (y-o-y). The number of newly listed properties dropped by 2.7% m-o-m. The MLS® Home Price Index (HPI) advanced by 0.8% m-o-m and 2.6% y-o-y. The actual (not seasonally adjusted) national average sale price climbed 8.4% y-o-y. Home sales recorded via Canadian MLS® Systems inched up by 0.6% November 2019. Notching its ninth straight monthly gain, activity stands 20% above the six-year low reached in February 2019 but 6% to 7% below heights recorded in 2016 and 2017. There was an almost even split between the number of local markets where activity rose and those where it declined. Higher sales across much of British Columbia and in the Greater Toronto Area (GTA) offset a decline in activity in Calgary. Actual (not seasonally adjusted) activity was up 11.3% year-over-year in November. Transactions surpassed year-ago levels in almost all of Canada’s largest urban markets. “Sales continue to improve in some regions and not so much in others,” said Jason Stephen, president of CREA. “The mortgage stress-test doesn’t help relieve the ongoing shortage of housing in markets where sales have improved, and it continues to hammer housing demand in markets with ample supply. All real estate is local, and nobody knows that better than a professional REALTOR®, your best source for information and guidance when negotiating the sale or purchase of a home,” said Stephen. “Home prices look set to continue rising in housing markets where sales are recovering amid an ongoing shortage of supply,” said Gregory Klump, CREA’s Chief Economist. “By the same token, home prices will likely continue trending lower in places where there’s a significant overhang of supply, perpetuated in part by the B-20 mortgage stress-test that continues to sideline homebuyers there.” The number of newly listed homes slid a further 2.7%, putting them among the lowest levels posted in the past decade. November’s decline was driven primarily by fewer new listings in the GTA. Slightly higher sales and a drop in new listings further tightened the national sales-to-new listings ratio to 66.3%, which is well above the long-term average of 53.7%. If current trends continue, the balance between supply and demand makes further home price gains likely. Considering the degree and duration to which market balance readings are above or below their long-term averages is the best way of gauging whether local housing market conditions favour buyers or sellers. Market balance measures that are within one standard deviation of their long-term average are generally consistent with balanced market conditions. Based on a comparison of the sales-to-new listings ratio with the long-term average, just over half of all local markets were in balanced market territory in November. That list includes the GTA and Lower Mainland of British Columbia, but market balance there is tightening. By contrast, an oversupply of homes relative to demand across much of Alberta and Saskatchewan means sales negotiations remain tilted in favour of buyers. Meanwhile, an ongoing shortage of supply of homes available for purchase across most of Ontario, Quebec and the Maritime provinces means sellers there hold the...
read moreCanadian home sales hold steady in October

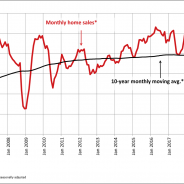
Ottawa, ON, November 15, 2019 – Statistics released today by the Canadian Real Estate Association (CREA) show national home sales were unchanged from September to October 2019. Highlights: National home sales held steady on a month-over-month (m-o-m) basis in October. Actual (not seasonally adjusted) activity was up 12.9% year-over-year (y-o-y). The number of newly listed properties declined by 1.8% m-o-m. The MLS® Home Price Index (HPI) advanced by 0.6% m-o-m and 1.8% y-o-y. The actual (not seasonally adjusted) national average sale price climbed 5.8% y-o-y. Home sales recorded via Canadian MLS® Systems remained steady in October 2019 following a string of monthly increases that began in March. Activity is now almost 20% above the six-year low reached in February 2019 but remains 7% below heights reached in 2016 and 2017. (Chart A) There was an almost even split between the number of local markets where activity rose and those where it declined. Higher sales in Greater Vancouver (GVA), the neighbouring Fraser Valley and Ottawa offset a monthly decline in activity in the Greater Toronto Area (GTA)—particularly in Central Toronto—and Hamilton-Burlington. Actual (not seasonally adjusted) activity rose 12.9% year-over-year. Transactions were up from year-ago levels in 80% of all local markets in October, including all of Canada’s largest urban markets. “Steady national activity in October hides how the mortgage stress-test remains a drag on many local housing markets where the balance between supply and demand favours homebuyers in purchase negotiations,” said Jason Stephen, president of CREA. “That said, all real estate is local, so market balance varies depending on location, housing type, and price segment. Nobody knows that better than a professional REALTOR®, your best source for information and guidance when negotiating the sale or purchase of a home,” said Stephen. “It’s a full-blown buyer’s market or on the cusp of one in a number of housing markets across the Prairies and in Newfoundland,” said Gregory Klump, CREA’s Chief Economist. “Homebuyers there have the upper hand in purchase negotiations and the mortgage stress-test has contributed to that by reducing the number of competing buyers who can qualify for mortgage financing while market conditions are in their favour.” The number of newly listed homes fell by 1.8% in October, with the GTA and Ottawa posting the largest declines. Almost a third of all housing markets posted a monthly decline of at least 5%, while about a fifth of all markets posted a monthly increase of at least 5%. Steady sales and fewer new listings further tightened the national sales-to-new listings ratio to 63.7%. This measure has been increasingly rising above its long-term average of 53.6%. Its current reading suggests that sales negotiations are becoming increasingly tilted in favour of sellers; however, the national measure continues to mask significant regional variations. Considering the degree and duration to which market balance readings are above or below their long-term averages is the best way of gauging whether local housing market conditions favour buyers or sellers. Market balance measures that are within one standard deviation of their long-term average are generally consistent with balanced market conditions. Based on a comparison of the sales-to-new listings ratio with the long-term average, just over two-thirds of all local markets were in balanced market territory in October 2019, including the GTA and Lower Mainland of British Columbia. Nonetheless, sales...
read moreCanadian home sales rise again in September

Ottawa, ON, October 15, 2019 – Statistics released today by the Canadian Real Estate Association (CREA) show national home sales were up slightly in September 2019. Highlights: National home sales rose 0.6% month-over-month (m-o-m) in September. Actual (not seasonally adjusted) activity was up 15.5% year-over-year (y-o-y). The number of newly listed properties edged back by 0.6% m-o-m. The MLS® Home Price Index (HPI) advanced by 0.5% m-o-m and 1.3% y-o-y. The actual (not seasonally adjusted) national average sale price was up 5.3% y-o-y. Home sales recorded via Canadian MLS® Systems advanced for the seventh consecutive month, raising them 18% above the six-year low reached in February 2019 but leaving them about 8% below highs reached in 2016 and 2017. (Chart A) Activity was up in slightly more than half of all local markets, led by Greater Vancouver (GVA) and the Fraser Valley (which together constitute the Lower Mainland of British Columbia). Actual (not seasonally adjusted) sales activity was up 15.5% year-over-year, reflecting the combination of slow sales in September 2018 and a rebound in activity this year. Transactions were up from year-ago levels in all of Canada’s largest urban markets, including the Lower Mainland of British Columbia, Calgary, Edmonton, Winnipeg, the Greater Toronto area (GTA), Hamilton-Burlington, Ottawa and Montreal. “National sales activity has begun to rebound in recent months,” said Jason Stephen, president of CREA. “That said, all real estate is local, so there’s a lot of variation in the strength of the rebound depending on the housing type, location and price segment. Nobody knows that better than a professional REALTOR®, your best source for information and guidance when negotiating the sale or purchase of a home,” said Stephen. “Home sales activity and prices are improving after having weakened significantly in a number of housing markets,” said Gregory Klump, CREA’s Chief Economist. “How long the current rebound continues depends on economic growth, which is being subdued by trade and business investment uncertainties.” The number of newly listed homes edged back by 0.6%. The small increase in sales combined with the small decline in new supply tightened the national sales-to-new listings ratio to 61.3% in September. This measure has been increasingly rising above its long-term average of 53.6%. At this point, this measure remains in balanced market territory, but is favouring sellers more than buyers. Considering the degree and duration to which market balance readings are above or below their long-term averages is the best way of gauging whether local housing market conditions favour buyers or sellers. Market balance measures that are within one standard deviation of their long-term average are generally consistent with balanced market conditions. Based on a comparison of the sales-to-new listings ratio with the long-term average, three-quarters of all local markets were in balanced market territory in September 2019, including the GTA and Lower Mainland of British Columbia. Of the remainder, the ratio was in sellers market territory in all housing markets except Saskatoon and Southeast Saskatchewan. The number of months of inventory is another important measure of the balance between sales and the supply of listings. It represents how long it would take to liquidate current inventories at the current rate of sales activity. There were 4.5 months of inventory on a national basis at the end of September 2019 – the lowest level recorded...
read moreAltus Group Partners with The Canadian Real Estate Association and its Member Real Estate Boards and Associations to Expand the MLS® Home Price Index Nationally
Advanced AVM technology from Altus Group combined with extensive data from real estate boards and associations delivers first national Canadian index making it one of largest and most comprehensive in the world TORONTO (October 2, 2019) — Altus Group Limited (“Altus Group”) (TSX: AIF), a leading provider of software, data solutions and independent advisory services to the global commercial real estate (“CRE”) industry, together with The Canadian Real Estate Association (“CREA”) and the Founding Boards, including the Greater Vancouver Real Estate Board, the Fraser Valley Real Estate Board, the Calgary Real Estate Board, the Toronto Regional Real Estate Board, and the Quebec Professional Association of Real Estate Brokers, announced the broadening of their partnership to expand CREA’s Multiple Listing Service® (“MLS®”) Home Price Index nationally. The MLS® Home Price Index is the most advanced and accurate tool relied on by the industry to gauge a neighbourhood’s home price levels and trends. The MLS® Home Price Index was pioneered by CREA and the Founding Boards and leverages Altus Group’s proprietary technology and sophisticated statistical models. Altus Group developed the technology that powers the MLS® Home Price Index in 2009 which analyzes all of the sales data from a board or association’s MLS® System, applies a value to a “typical” home for various types of dwellings for each submarket, and tracks the relative change in value over time. Through the timely access to data inputs directly from the real estate boards and associations, real estate transactions across the country are captured on a real-time basis to ensure the index values capture market trends and activity to allow for faster insights for realtors and their clients. Leveraging its machine learning expertise along with its proprietary knowledge of automated valuation models (“AVM”) and data cleansing, Altus Group has continued to improve the technology that powers the MLS® Home Price Index and supports its expansion to markets across Canada. “We’re excited to announce that for the first-time there is an agreement in place for all Canadian real estate boards and associations to join the MLS® Home Price Index and create a truly national housing price index that encompasses all of the housing market activity. Providing all of our members with this level of analysis and visibility into the market trends is invaluable,” said Michael Bourque, CEO of CREA. “We’re pleased to continue and further expand our strategic partnership with Altus Group to deliver greater value to REALTORS® and the Canadian real estate market by providing consistent and reliable insights on a local and national level.” This new agreement provides a framework to expand the MLS® Home Price Index from the current 18 real estate boards to all of CREA’s 90 real estate boards and associations across Canada, representing more than 130,000 REALTOR® members. The expansion enables CREA and all real estate boards and associations to jointly provide a truly national MLS® Home Price Index for Canada. “This is a reflection of the success we’ve achieved in our partnership to date, and the combination of machine learning and AVM technology delivers a powerful tool at a scale that brings greater value to everyone across the industry,” said Richard Simon, Managing Director of Data Solutions at Altus Group. “This expanded agreement with Altus Group enables us to support REALTORS® with the first truly national Housing Price...
read moreStatement from The Canadian Real Estate Association in response to the Conservative Party housing measures announcement
Ottawa, ON, September 23, 2019 — With Election 2019 underway, CREA welcomes today’s announcement that a Conservative government would introduce new measures to make it easier for first-time homebuyers to buy a home. “REALTORS® have long asked for common-sense solutions designed to help Canadians to purchase a home of their own,” said Jason Stephen, President of The Canadian Real Estate Association. “The measures announced today by the Conservative party include suggestions we’ve been making to policymakers, such as fixing the mortgage stress test and removing it for mortgage renewals. We’re also pleased with the proposal to increase amortization periods, which ultimately provides greater flexibility for home buyers looking at financing to purchase a home of their own.” The announcement today also included other measures. Surplus federal land being made available for development to increase housing will help with home prices, as increased supply will help satisfy increasing demand for housing across the country. We also welcome the opportunity to address money laundering and other corrupt practices in the housing sector. Visit CREA’s Election 2019 REALTOR® Resource Hub to find out more about our suggestions. – 30 – About The Canadian Real Estate Association The Canadian Real Estate Association (CREA) is one of Canada’s largest single-industry associations. CREA works on behalf of more than 130,000 REALTORS® who contribute to the economic and social well-being of communities across Canada. Together they advocate for property owners, buyers and sellers. For more information, please contact: Pierre Leduc, Media Relations The Canadian Real Estate Association Tel.: 613-237-7111 or 613-884-1460 E-mail:...
read moreCanadian home sales edge higher in August
Ottawa, ON, September 16, 2019 – Statistics released today by the Canadian Real Estate Association (CREA) show national home sales were up in August 2019. Highlights: National home sales rose 1.4% month-over-month (m-o-m) in August. Actual (not seasonally adjusted) activity was up 5% year-over-year (y-o-y). The number of newly listed homes climbed 1.1% m-o-m. The MLS® Home Price Index (HPI) advanced by 0.8% m-o-m and 0.9% y-o-y. The actual (not seasonally adjusted) national average sale price was up 3.9% y-o-y. Home sales recorded via Canadian MLS® Systems advanced for the sixth consecutive month in August. Transactions are now running almost 17% above the six-year low reached in February 2019, but remain about 10% below highs reached in 2016 and 2017. (Chart A) Activity was up in slightly more than half of all local markets, although monthly changes were generally modest across most of the country. Gains were led by a record-setting August in Winnipeg and a further improvement in the Fraser Valley. Moncton posted the biggest monthly decline in sales, returning to more normal levels after having recently jumped to record heights. Actual (not seasonally adjusted) sales activity was up 5% from where it stood in August 2018. The number of homes that traded hands was up from year-ago levels in most of Canada’s largest urban markets, including the Lower Mainland of British Columbia, Calgary, Winnipeg, the Greater Toronto (GTA), Ottawa and Montreal. “The mortgage stress-test has eased marginally and that’s helped some potential homebuyers,” said Jason Stephen, CREA’s President, “but the extent to which they’re adjusting to it continues to vary by community and price segment. All real estate is local. Nobody knows that better than a professional REALTOR®, your best source for information and guidance when negotiating the sale or purchase of a home,” said Stephen. “The recent marginal decline in the benchmark five-year interest rate used to assess homebuyers’ mortgage eligibility, together with lower home prices in some markets, means that some previously sidelined homebuyers have returned,” said Gregory Klump, CREA’s Chief Economist. “Even so, the mortgage stress-test will continue to limit homebuyers’ access to mortgage financing, with the degree to which it further weighs on home sales activity continuing to vary by region.” The number of newly listed homes rose 1.1% in August. With sales and new supply up by similar magnitudes, the national sales-to-new listings ratio was 60.1%—little changed from July’s reading of 60.0%. The measure has risen above its long-term average (of 53.6%) in recent months, which indicates a tighter balance between supply and demand and a growing potential for price gains. Considering the degree and duration to which market balance readings are above or below their long-term averages is the best way of gauging whether local housing market conditions favour buyers or sellers. Market balance measures that are within one standard deviation of their long-term average are generally consistent with balanced market conditions. Based on a comparison of the sales-to-new listings ratio with the long-term average, about three-quarters of all local markets were in balanced market territory in August 2019. Of the remainder, the ratio was above the long-term average in all markets save for some in the Prairie region. The number of months of inventory is another important measure of the balance between sales and the supply of listings. It represents...
read more